
As a vibrant metropolis nestled along the shores of Lake Michigan, Chicago consistently ranks among the top destinations for travelers seeking a blend of world-class culture, architectural marvels, and diverse culinary experiences. However, a factor that can significantly impact the enjoyment of any visit, and indeed the daily lives of its residents, is the city’s air quality. Understanding the fluctuations in air quality, often visualized through readily accessible maps, is crucial for both short-term visitors and long-term planners. This exploration delves into the reasons behind Chicago’s air quality, focusing on the contributing factors and how they manifest, particularly when the air is perceived as poor.

Understanding Air Quality Indices and Their Significance
The assessment of air quality is not a subjective observation but rather a scientifically measured phenomenon. The primary tool for this measurement is the Air Quality Index (AQI). The AQI is a standardized system used by government agencies to communicate to the public how polluted the air currently is or how polluted it is forecast to become. In the United States, the Environmental Protection Agency (EPA) uses the AQI to report and forecast air pollution levels.
The AQI is calculated based on five major air pollutants: ground-level ozone, particle pollution (particulate matter), carbon monoxide, sulfur dioxide, and nitrogen dioxide. Each pollutant has a specific associated AQI value. The AQI for a given area is determined by the highest of these individual AQI values. The AQI scale ranges from 0 to 500, with higher values indicating greater air pollution and associated health risks.
- Good (0-50): Air quality is satisfactory, and air pollution poses little or no risk.
- Moderate (51-100): Air quality is acceptable; however, there may be a moderate health concern for a very small number of people who are unusually sensitive to air pollution.
- Unhealthy for Sensitive Groups (101-150): Members of sensitive groups may experience health effects. The general public is less likely to be affected.
- Unhealthy (151-200): Everyone may begin to experience health effects; members of sensitive groups may experience more serious health effects.
- Very Unhealthy (201-300): Health alert: everyone may experience more serious health effects.
- Hazardous (301-500): Health warnings of emergency conditions. The entire population is more likely to be affected.
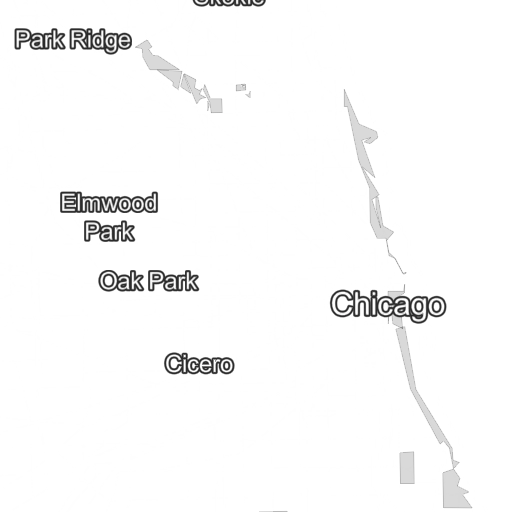
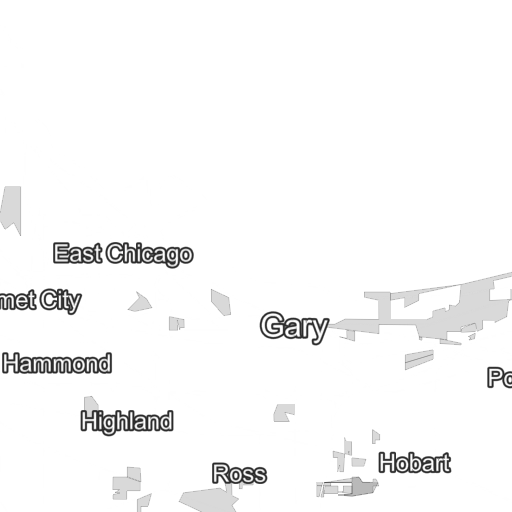
For travelers to Chicago, consulting an AQI map can provide immediate insight into current conditions. These maps, often color-coded, allow for a quick visual assessment of pollution levels across different neighborhoods. A glance at a “Why Is Chicago Air Quality Bad Today Map?” would likely highlight areas with AQI readings in the “Unhealthy for Sensitive Groups” to “Hazardous” ranges, prompting travelers to consider adjustments to their outdoor plans.
The Role of Chicago’s Geography and Climate
Chicago’s geographical location on the southwestern tip of Lake Michigan plays a dual role in its air quality. On one hand, the lake breeze can often act as a natural air purifier, circulating fresh air and dispersing pollutants. This is particularly noticeable during warmer months when the lake’s moderating effect can lead to cooler, cleaner air along the lakefront compared to inland areas.
However, this same geographical setting can also trap pollutants. When weather patterns create inversions, where a layer of warm air settles above cooler air near the ground, pollutants can become trapped and accumulate. This is especially true during stagnant weather conditions, such as prolonged periods of calm winds or when prevailing winds blow from industrial or agricultural areas towards the city. Chicago’s continental climate also means it experiences significant temperature variations, which can influence atmospheric conditions conducive to pollutant buildup.
The transition seasons, spring and fall, can sometimes present challenges. Spring can bring about increased agricultural activity, leading to dust and particulate matter. Fall, on the other hand, can see more frequent temperature inversions and increased residential heating, both of which can impact air quality.
Primary Sources of Air Pollution in Chicago
The “bad” air quality in Chicago is not attributable to a single source but rather a complex interplay of various human activities and natural phenomena. Understanding these sources is key to interpreting an air quality map.
Vehicular Emissions
Chicago, being a major metropolitan hub, has a vast network of roadways and a high volume of vehicular traffic. Cars, trucks, and buses emit a range of pollutants, including nitrogen oxides (NOx), carbon monoxide (CO), and particulate matter (PM2.5 and PM10). These emissions are a primary contributor to ground-level ozone formation, especially on hot, sunny days. Prolonged traffic congestion, common during rush hours or due to construction, exacerbates these emissions, leading to localized spikes in pollution. An air quality map might show higher AQI readings in areas surrounding major expressways like the Dan Ryan Expressway or the Kennedy Expressway, particularly during peak traffic times.
Industrial and Commercial Activities
While Chicago has diversified its economy, industrial and commercial activities remain a significant source of air pollution. Manufacturing plants, power generation facilities, and even smaller businesses that utilize combustion processes can release pollutants such as sulfur dioxide (SO2), particulate matter, and volatile organic compounds (VOCs). The historical industrial legacy of the city means that some of these facilities are located within or in close proximity to residential areas, directly impacting the air quality experienced by millions. Air quality maps often reflect the influence of these point sources, with elevated AQI readings in areas downwind from major industrial complexes.
Residential and Commercial Heating and Cooling
The demand for heating and cooling in a city with extreme temperature variations contributes to air pollution. During colder months, the burning of fossil fuels for heating in homes, apartments, and commercial buildings releases particulate matter and other pollutants. Similarly, during warmer months, the use of air conditioning systems, while essential for comfort, can indirectly contribute to air pollution through increased energy demand, often met by power plants that emit pollutants.
Other Contributing Factors
- Wildfires and Regional Transport: Smoke from distant wildfires, even those occurring hundreds or thousands of miles away, can travel vast distances and significantly degrade air quality in Chicago. These plumes of smoke, rich in fine particulate matter, can cause AQI levels to reach “Hazardous” in a matter of hours. An air quality map would show a widespread and uniform increase in pollution across the entire metropolitan area during such events.
- Construction and Demolition: Ongoing construction and demolition projects in a rapidly developing city like Chicago can release significant amounts of dust and particulate matter into the air. This localized pollution can impact the immediate vicinity of these sites.
- Agricultural Activity: While not directly within the city limits, agricultural activities in surrounding regions can contribute to air pollution through dust, ammonia emissions (which can form secondary particulate matter), and pesticide drift. Prevailing winds can carry these pollutants into the Chicago metropolitan area.
Navigating Chicago with Air Quality in Mind
For visitors and residents alike, being aware of Chicago’s air quality can significantly enhance comfort and well-being. The availability of real-time air quality maps is an invaluable resource.
Utilizing Air Quality Maps
Websites and mobile applications dedicated to air quality monitoring provide detailed, often real-time, maps of Chicago. These maps typically display AQI levels by neighborhood or zip code, allowing individuals to make informed decisions about their activities.
When an air quality map indicates elevated pollution levels, especially in the “Unhealthy” categories, it is advisable to:
- Limit Outdoor Activity: Sensitive individuals, including children, the elderly, and those with respiratory or cardiovascular conditions, should minimize strenuous outdoor exertion. Even healthy individuals might experience discomfort.
- Choose Indoor Activities: Opt for museums like the Art Institute of Chicago, indoor attractions such as Navy Pier’s entertainment venues, or enjoy the diverse dining scene at one of Chicago’s many restaurants.
- Monitor Personal Health: Pay attention to any symptoms such as coughing, shortness of breath, or eye irritation, and seek medical advice if necessary.
- Consider Air Filtration: For those staying in hotels or residences, ensuring good ventilation and potentially using air purifiers can help mitigate the impact of poor outdoor air quality.
The Future of Chicago’s Air Quality
Efforts are continuously being made to improve air quality in Chicago. These include initiatives to promote public transportation, electric vehicles, renewable energy sources, and stricter regulations on industrial emissions. The city’s commitment to sustainability and green initiatives, such as expanding its network of green spaces and urban forestry, also plays a role in long-term air quality improvement.
While days with poor air quality will likely continue to occur due to a combination of local and regional factors, an informed approach, utilizing resources like air quality maps, empowers everyone to navigate Chicago safely and enjoyably, regardless of the day’s atmospheric conditions. From the iconic skyline to the bustling streets, Chicago remains a captivating destination, and understanding its environmental nuances only enhances the travel experience.
LifeOutOfTheBox is a participant in the Amazon Services LLC Associates Program, an affiliate advertising program designed to provide a means for sites to earn advertising fees by advertising and linking to Amazon.com. Amazon, the Amazon logo, AmazonSupply, and the AmazonSupply logo are trademarks of Amazon.com, Inc. or its affiliates. As an Amazon Associate we earn affiliate commissions from qualifying purchases.