
Understanding Political Geography in the Golden State
California, a state renowned for its diverse landscapes, vibrant culture, and significant economic influence, is often perceived as a predominantly liberal stronghold. However, understanding the political leanings of its vast and varied populace requires a deeper dive into its geographical and demographic makeup. The question of “what percentage of California is red voting?” delves into the nuances of political affiliation across its counties, cities, and congressional districts, moving beyond simplistic generalizations. This exploration aims to illuminate the pockets of conservative sentiment that exist within the Golden State and how they shape its political discourse and electoral outcomes.

Historical Context of Political Leanings in California
California’s political landscape has undergone significant shifts over the decades. While historically it has seen periods of strong Republican leadership, particularly in the mid-20th century, the latter part of the 20th century and the early 21st century have witnessed a pronounced trend towards Democratic dominance at the state and federal levels. This shift is often attributed to demographic changes, including a growing Hispanic and Asian population, increased urbanization, and a migration of individuals from more politically conservative states seeking opportunities in California’s booming tech and entertainment industries.
Despite this overarching trend, it is crucial to recognize that “California” is not a monolithic political entity. The state’s sheer size and diversity mean that different regions exhibit distinct political inclinations. The coastal urban centers like Los Angeles, San Francisco, and San Diego consistently lean Democratic, driven by their diverse populations and progressive economies. Conversely, more rural areas, particularly in the Central Valley and the northern counties, tend to exhibit stronger conservative voting patterns. Examining voter registration data, precinct-level results, and congressional district compositions provides a clearer picture of this intricate political tapestry.
Shifting Demographics and Political Affiliation
The demographic evolution of California has been a primary driver of its changing political landscape. As the state’s population has diversified, so too have its voting patterns. The rise of the Hispanic and Asian American communities, for instance, has had a profound impact. While these communities are not monolithic in their political views, statistically, they have shown an increasing tendency to align with the Democratic Party. This is often linked to issues such as immigration policy, social programs, and economic opportunity.
Furthermore, the influx of new residents from other states, many of whom are drawn to California for its economic opportunities in sectors like technology and entertainment, has also influenced its political character. While this migration has generally contributed to the state’s liberal leanings, it’s not a uniform phenomenon. The reasons for migration and the socioeconomic backgrounds of these new arrivals can lead to a variety of political perspectives. The suburban sprawl, once a bedrock of Republican support in many parts of the country, has also become increasingly diverse and competitive in California, blurring traditional political lines.
Identifying “Red” Voting Regions and Counties
To ascertain the percentage of California that votes “red” (Republican), one must look beyond statewide election results and examine the granular data at the county and even precinct level. While the state as a whole consistently votes Democratic in presidential and gubernatorial elections, numerous counties, particularly in the northern and central parts of the state, maintain a strong Republican presence.
Notable examples of historically or consistently Republican-leaning counties include Shasta County, Tehama County, Modoc County, and Tulare County. These areas often share characteristics such as a higher proportion of rural populations, reliance on agriculture and natural resource industries, and a more conservative cultural outlook. In these regions, Republican candidates often secure significant majorities, demonstrating a clear divergence from the coastal urban centers.
County-Level Analysis of Republican Strongholds
A detailed county-by-county breakdown reveals the extent of Republican support. Counties in the Sierra Nevada foothills and the far northern reaches of California, such as Placer County (though increasingly competitive), Nevada County, and the aforementioned northern counties, frequently show a majority of votes cast for Republican candidates. The Central Valley, a major agricultural hub, also presents a complex picture. While some of its urban centers are trending more Democratic, many of its more rural counties, such as Kern County and Fresno County (in certain elections and demographics), have historically strong Republican voting blocs.

The percentage of voters registered as Republican versus Democrat also offers insight, though registration does not always translate directly to voting behavior. However, in these predominantly “red” counties, Republican registration often mirrors or exceeds Democratic registration, reinforcing their conservative leanings. Understanding the specific demographics within these counties—age, ethnicity, occupation, and educational attainment—provides further context for their voting patterns.
Congressional Districts: A Microcosm of Political Division
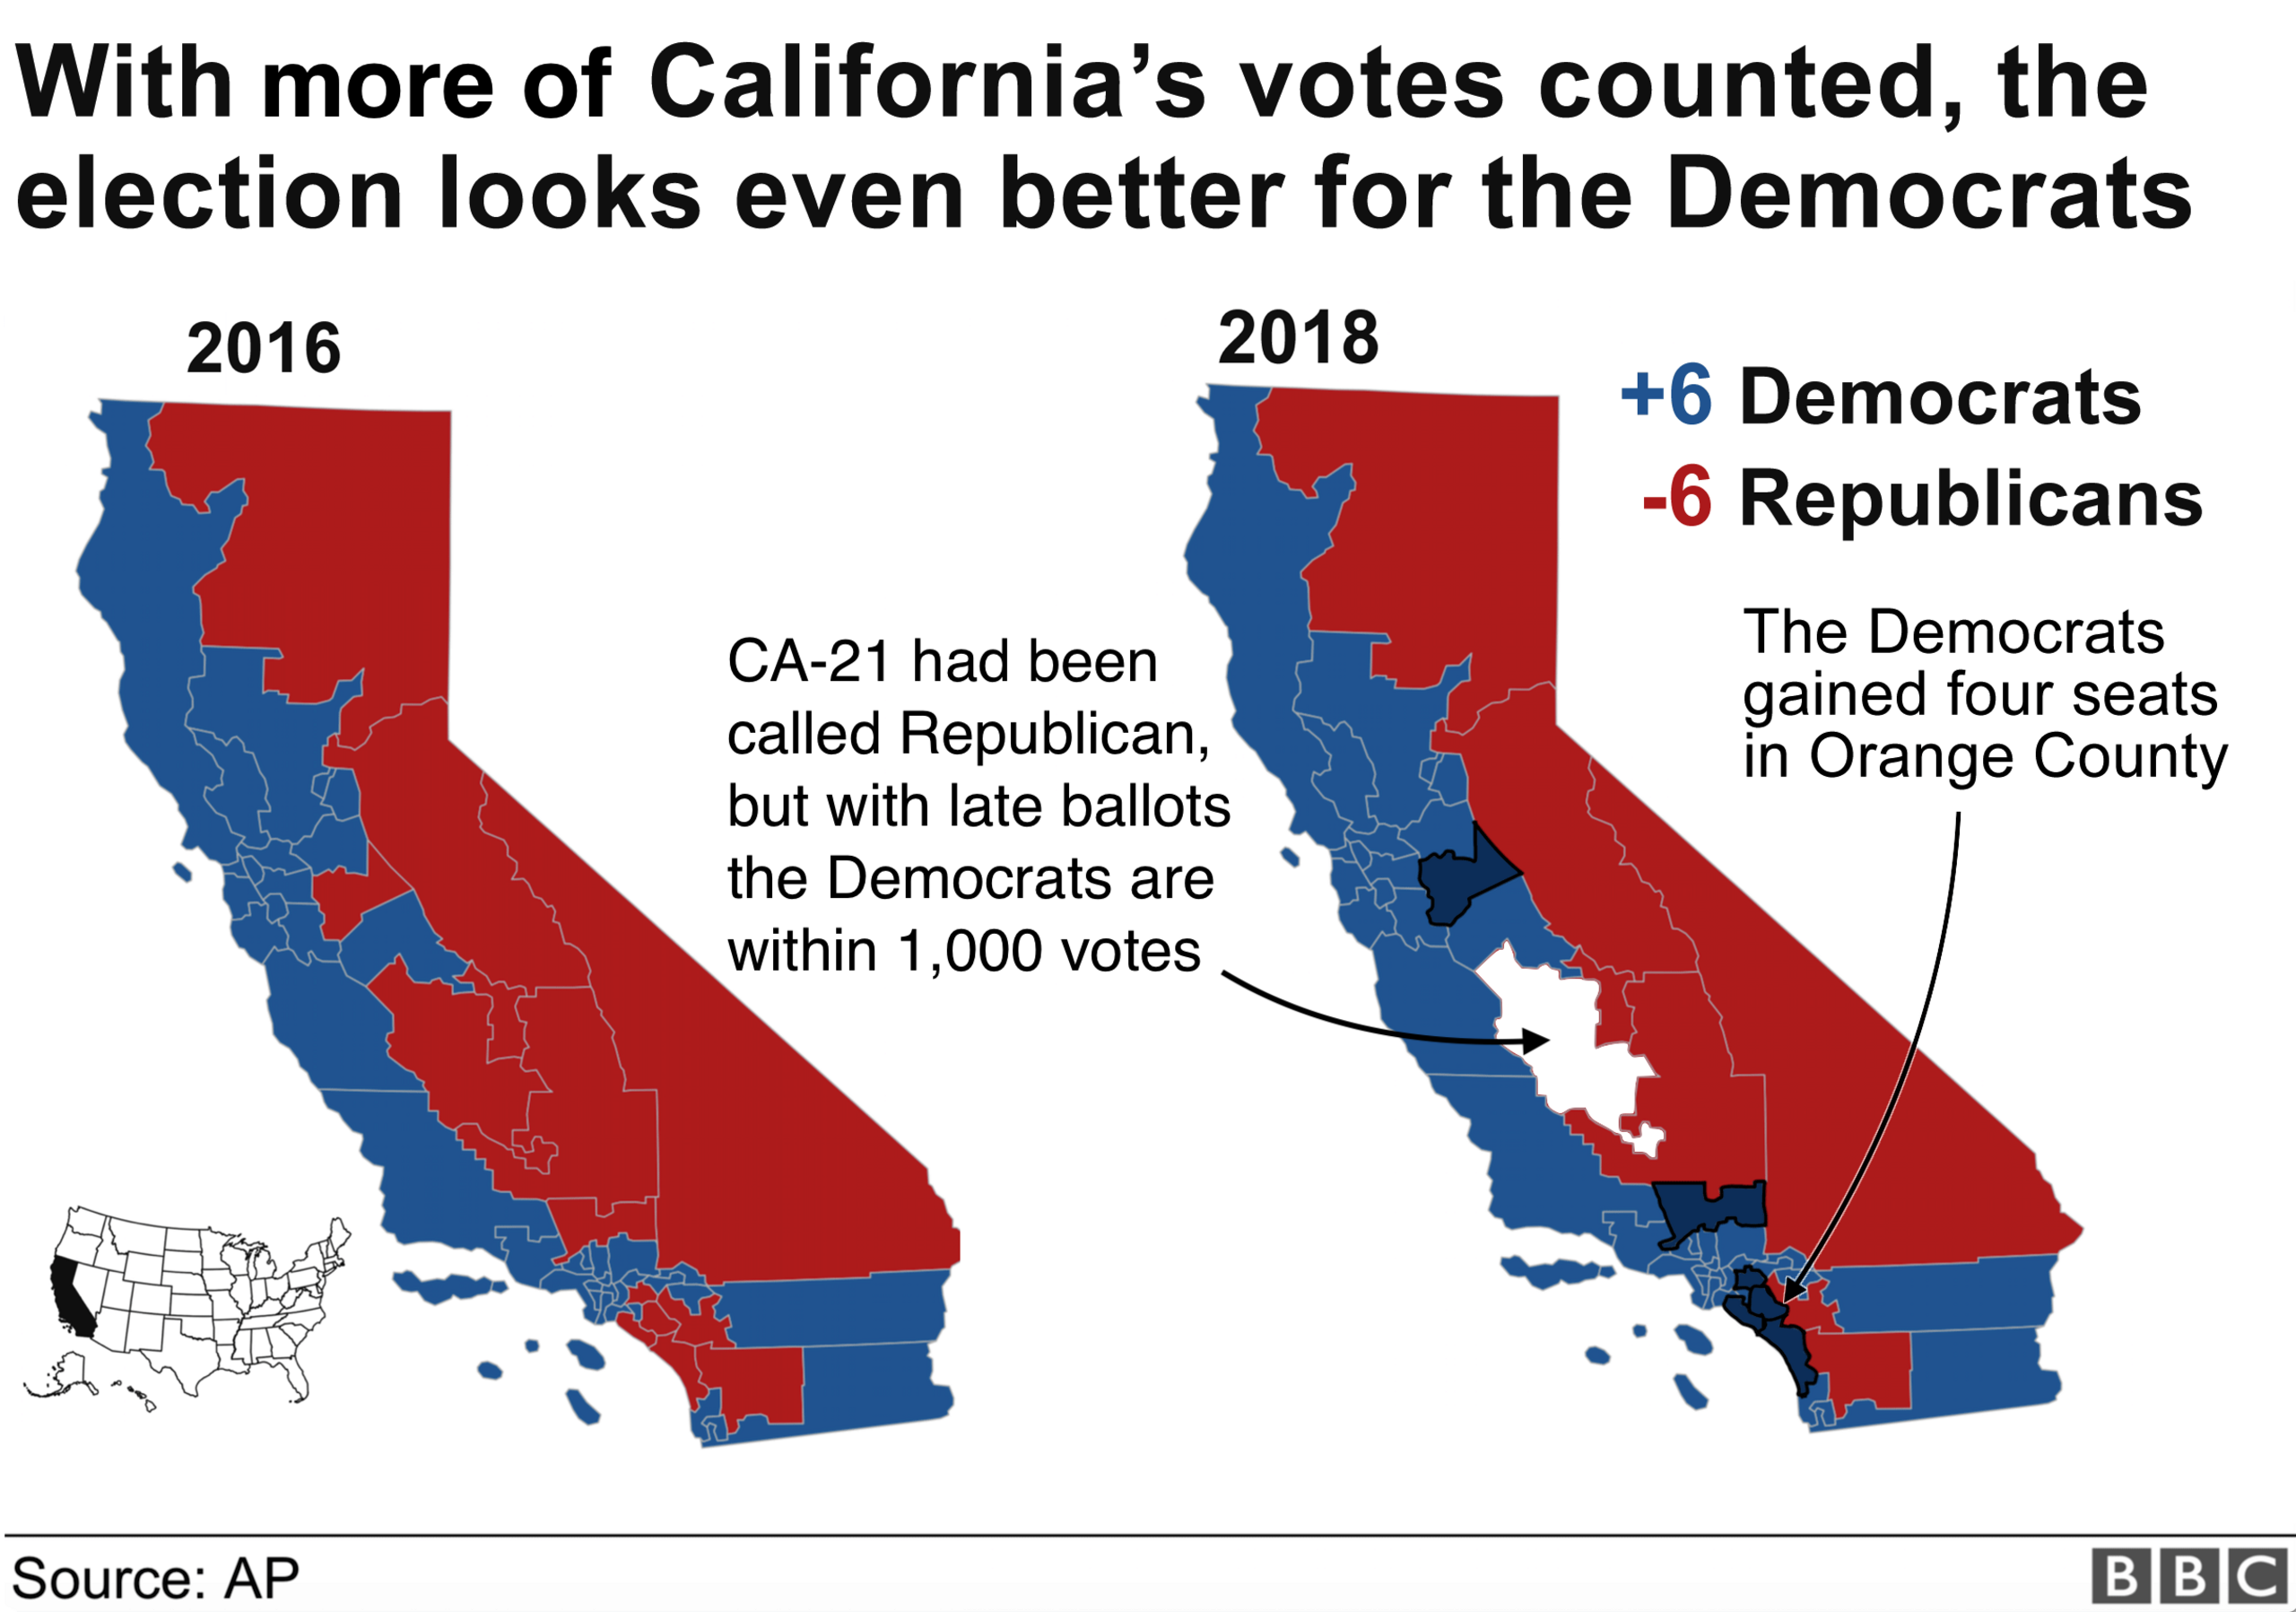
California’s 53 congressional districts offer a more nuanced view of its political geography. While many of these districts, particularly those encompassing major metropolitan areas like Los Angeles County and Orange County, are firmly in Democratic hands, a significant number of districts, primarily in the more rural and suburban inland areas, are represented by Republicans.
These “red” congressional districts are often characterized by a majority of voters who identify as Republican, or who consistently vote for Republican candidates in federal elections. Analyzing the results of recent congressional races in these districts provides concrete data on the prevalence of “red” voting. For example, districts in the Central Valley, parts of Southern California’s inland empire, and more sparsely populated northern regions tend to be more competitive or lean Republican.
Mapping “Red” Districts and Their Characteristics
The geographic distribution of these Republican-held congressional seats highlights the persistent conservative presence in specific regions of California. These districts often encompass a significant rural population, rely on industries such as agriculture, manufacturing, or resource extraction, and may have a cultural or religious conservatism that influences voting behavior. Understanding the specific issues that resonate with voters in these districts—such as property rights, economic deregulation, or traditional values—is key to comprehending their political inclinations.
Conversely, the overwhelming number of Democratic-represented districts underscores the state’s overall liberal trajectory. These districts are typically found in urban and coastal areas, characterized by diverse economies, large metropolitan populations, and a progressive social and political outlook. The contrast between these “blue” and “red” districts within the same state illustrates the profound political and cultural diversity that defines California.
The Nuances of “Red Voting” in a Blue State
While California is undeniably a “blue state” at the aggregate level—consistently voting for Democratic presidential candidates and maintaining Democratic majorities in its congressional delegation and state legislature—the question of “what percentage of California is red voting?” moves beyond simple state-wide tallies. It acknowledges the existence of substantial Republican constituencies and their impact on local and regional politics.
The percentage of votes cast for Republican candidates can fluctuate significantly depending on the office (presidential, gubernatorial, congressional, state legislature, local initiatives) and the specific election cycle. Furthermore, voter registration statistics, while indicative, do not tell the whole story. Many voters are registered as “No Party Preference” and can swing between parties, adding another layer of complexity to the analysis.
Beyond Simple Percentages: Factors Influencing “Red Voting”
Several factors contribute to the enduring “red voting” patterns observed in parts of California:
- Rural vs. Urban Divide: The classic urban-rural political divide is very much present in California. Rural areas tend to be more conservative due to different economic bases, cultural values, and a greater emphasis on individual liberties and limited government intervention.
- Economic Industries: Regions heavily reliant on agriculture, oil and gas, or certain types of manufacturing often exhibit stronger conservative leanings, aligning with Republican platforms that often favor deregulation and lower taxes for these industries.
- Demographic Composition: While overall California is diversifying, specific pockets of older, white populations, particularly in more rural or exurban areas, may lean more Republican.
- Cultural and Social Values: Areas with a stronger adherence to traditional social values and religious conservatism are more likely to support Republican candidates.
- Historical Trends: Some counties and regions have a long history of Republican voting, creating a persistent voting bloc that is resistant to demographic or societal shifts.
In conclusion, while the overall political narrative of California leans heavily Democratic, a significant portion of its population, concentrated in specific geographic areas, consistently votes Republican. Quantifying this “red voting” percentage requires a detailed examination of county-level data, congressional district results, and an understanding of the underlying demographic, economic, and cultural factors that shape these distinct political landscapes within the Golden State.
LifeOutOfTheBox is a participant in the Amazon Services LLC Associates Program, an affiliate advertising program designed to provide a means for sites to earn advertising fees by advertising and linking to Amazon.com. Amazon, the Amazon logo, AmazonSupply, and the AmazonSupply logo are trademarks of Amazon.com, Inc. or its affiliates. As an Amazon Associate we earn affiliate commissions from qualifying purchases.